
Boston Pizza “Here To Make You Happy”
Sustained Success (GOLD)
Client Credits: Boston Pizza International
Steve Silverstone, EVP Marketing
Alexander Green, VP Marketing
Joanne Forrester, VP, Marketing
Agency Credits: TAXI Canada
Darren Clarke, TAXI, Executive Creative Director
Niall Kelly, TAXI, Creative Director
Edith Rosa, TAXI, Group Account Director
PHD, Media Agency
Highroad Communications
Section I — BASIC INFORMATION
| Business Results Period (Consecutive Months): | January 2011–August 2013 (31 Months) |
| Start of Advertising/Communication Effort: | January 1, 2011 |
| Base Period as a Benchmark: | January 2009–December 2010 |
Section II — SITUATION ANALYSIS
a) Overall Assessment
In 1964, Boston Pizza (BP) opened for business in Edmonton, Alberta. And for the last 50 years, the casual dining restaurant has been growing – from this single location to a 360-store-strong Canadian behemoth, built on their unique concept combining a welcoming family dining room and lively sports bar.
The end of the last decade, however, was not an easy time for the casual dining industry. After seeing strong growth through the beginning of the 2000s, the category, like all other industries, was hit hard by the Great Recession of 2008. The category is measured in same store sales growth (SSSG), which refers to the difference in revenue generated by a business’s existing stores over the last year compared to the year before. In 2009, the category posted its worst results, with SSSG falling 2.6% [Footnote [1], which was likely to continue, as research found that dining out was the number one, post-recession cutback, with 49% of Canadians planning to make those cutbacks permanent [Footnote [2].
As Canada began to emerge from the recession in 2010, many of BP’s competitors, who had been using a deep-discount strategy, reverted back to what had worked best for them prerecession: connecting with families through Mom, using food-centric messaging and promotional offers.
After seeing the impact of the recession on the category as a whole, Boston Pizza was not content to simply follow the pack and was keen to carve out a new space for the brand that would help defend against further downturns in the market.
b) Resulting Business Objectives
1) Increase Sales
- Long Term: In 2009 and 2010, BP’s average SSSG had hit -3.15% [Footnote [1]. After such lows, the main objective for the brand was to stop the decline and to begin growing the business again. With the effects of the recession beginning to subside at the end of 2010, BP set a goal of growing same store sales by 1.5% per year.
- Short Term: BP’s marketing calendar was built around quarterly campaigns focused on specific menu items or offerings. Objectives for these campaigns varied depending on the offering and/or time of year, but the success of these short-term campaigns would serve as the building blocks of the brand’s annual growth.
2) Differentiate the Brand
Outside of the sales numbers, another key objective was the overall development and differentiation of the brand. The category was getting more and more crowded with brands competing for the same audience, and BP saw an opportunity to reinvent itself and truly stand out in the category.
c) Annual Media Budget
Over $5 million
d) Geographic Area
Canada (Excluding Quebec)
Footnote [1]: Client sales data.
Footnote [2]: Hotspex, 2011 Brand U&A; Tracking, June 2011.
Section III — STRATEGIC THINKING
a) Analysis and Insight
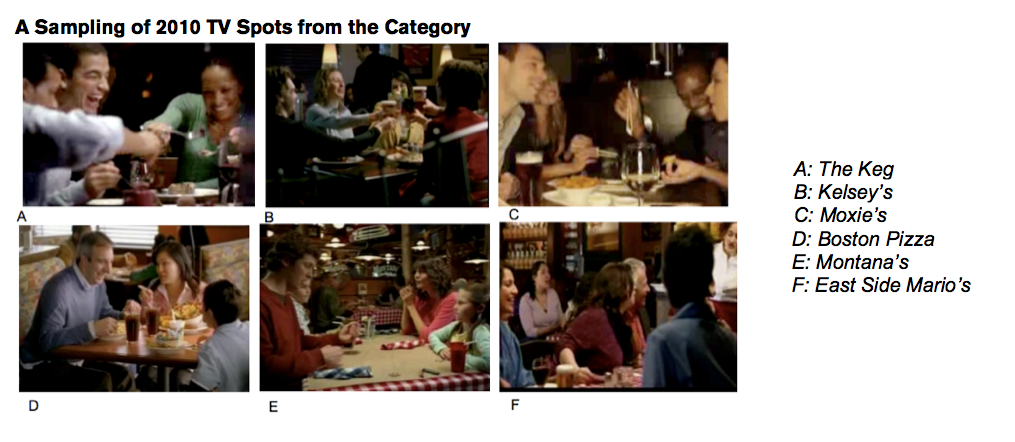
Like so many other categories, casual dining had become a sea of sameness, driven by three key conventions: 1) Mom is the key decision maker when it comes to eating out; 2) promotions and discounts are the way to drive the door; and 3) advertising should always focus on the food. This led to ad after ad of happy, smiling families sitting around tables filled with attractive dishes that closed on an attractive offer.
Looking closely, BP saw an opportunity, an untapped market within the category: Dad. While Dad had always been a part of the communications, he was never the focal point. It was assumed that what Mom decided, Dad would support, and the whole family would be happy. BP recognized that this was its chance to differentiate itself from the competition by moving away from competing over Mom and, instead, focusing their attention on Dad.
At the time, however, Dads were a relatively untapped market for almost all marketing. Certainly marketing to men was extremely common, but outside of small promotions, speaking to Dads hadn’t truly been explored.
The first and perhaps most important observation BP made was that Dad is not one-dimensional. The role of the modern Dad had changed dramatically from that of his father, and those changes grew post-recession. In 2009, the percentage of working women was 58.3%, representing an all-time high of 47.9% of the total workforce [Footnote [1]. This meant that Dad’s responsibilities at home were increasing and he was becoming a more important presence and decision-maker. So, speaking to him as an important leader of the family would honour this new role.
At the same time, Dad was still a guy, the guy that many marketers focused on. BP didn’t want to forget about this side of him. Coming out of the recession, which was particularly tough on Dads, with male unemployment peaking at 3% higher than the female rate [Footnote [2], Dad was looking for a little extra comfort. He wanted some nights off, some time with the guys, and a chance to forget about all his other responsibilities. BP called this his “dude side.”
BP felt uniquely suited to address all sides of Dad. When he’s with his family, BP offers a comfortable dining room with a menu full of innovative items. When he’s out with the guys to watch the game, BP has a lively sports bar full of screens and the best food to pair with the action. And for nights in with family or friends, BP offers a take out and delivery (TOD) menu with unmatched variety so he can bring the excitement home.
Through this distinctive offering, BP envisioned a home away from home for Dads that they called Dad’s Happy Place.
b) Communication Strategy
Becoming Dad’s Happy Place meant a complete overhaul of how the brand communicated. They knew that they couldn’t forget about Mom, but to truly stand out, they would need to find a way to speak to Dad in an authentic way.
To do so, three key objectives were identified:
1) Use TV Differently: To reach the masses, TV would be a key component of the campaign communication, but BP knew they would need to break away from the traditional smiling faces-product shot equation. Instead, they would craft a series of quarterly campaigns using big stories and interesting characters to capture Dad’s attention and bring the brand to life, all while showcasing their offering.
2) Stay Fresh: To ensure that their new approach to TV and storytelling would connect, BP knew that keeping their communications fresh would be paramount to their success. With their competitors all telling the same stories, with the same faces and the same product shots, there was a huge opportunity to break through and really connect with Dad.
3) Build Campaigns for All Media: While TV would be the core of the communication strategy, BP knew that to really bring Dad’s Happy Place to life, consistency in messaging would be key. That meant extending the message to traditional, high-frequency touch points, like in-store POS and menus, but also to new relevant channels where Dad would never expect to encounter his restaurant of choice.
Footnote [1]: Statistics Canada, “Labour Force Survey”, 2010
Footnote [2]: Statistics Canada, “Indicators of Well-Being in Canada: Unemployment Rate”, 2012
Footnote [3] : Client sales data.
Footnote [4]: Statistics Canada, “Labour Force Survey”, 2010
Footnote [5] : Statistics Canada, “Indicators of Well-Being in Canada: Unemployment Rate”, 2012
Section IV — KEY EXECUTIONAL ELEMENTS
a)Media Used
TV, radio, OOH, website, microsite, social media, online advertising, SEM, online video, digital and social media apps, in-store POS, and merchandise.
b)Creative Discussion
Strategically, the goal of Dad’s Happy Place was to look at the casual dining market through a different lens. In a sense, BP was looking to redefine casual dining marketing by focusing on Dad – a different and often forgotten member of the audience.
To bring this to life creatively, BP decided that innovation would be the key theme for the campaign. Rather than simply presenting new or existing items using a guy-friendly voice, they would look to reinvent the things that Dad had come to know and love from the category over the years, all in an effort to ensure Dad’s happiness. And so Here to Make You Happy was born.
This platform allowed BP to surprise Dad with new stories and approaches to his old favourites. While every sports bar was promising “the best wings in town,” BP was inventing a professional wing critics association that would honour BP’s new wings with a coveted and completely fictional award, the Crystal Wingy. While many of its competitors were sending mailer after mailer with deeper and deeper delivery discounts, BP released a whole new kind of cookbook with recipes that required nothing but your finger and your laptop. When the boneless wings craze hit and the competition piled on, BP thought it would be more interesting to employ the famous, and fictitious, food innovator Terry Peters to invent an entirely new product – the All Meat Wing.
To BP, making Dad happy meant more than simply giving him what he wanted, it meant delivering those things in ways he would never expect.
Later in this section, five quarterly campaigns that demonstrate BP’s new and unique approach are showcased. Sample creative from point-of-sale pieces and menus will also be displayed to show how the concept extended to the brand’s owned, high-touch media.
c)Media Discussion
With such a fresh and interesting approach to the campaign, BP knew it wouldn’t need to reinvent the wheel when it came to media. As mentioned, BP was determined to find ways to connect with Dads outside of traditional channels but was also aware that they could achieve tremendous reach through TV, especially on properties that Dad loved. This meant that sports became the key component of the media buy, both in broadcast and online.
Section V — BUSINESS RESULTS
a) Sales/Share Results
Boston Pizza’s Here to Make you Happy achieved – and surpassed – all of the brand’s stated objectives:
1) Increase Sales
a. Long Term – Increase Same Stores Sales Growth by 1.5% Per Year
The 31 months of the Here to Make You Happy campaign represented 11 quarters, and BP saw their SSSG increase in all 11 of those quarters:
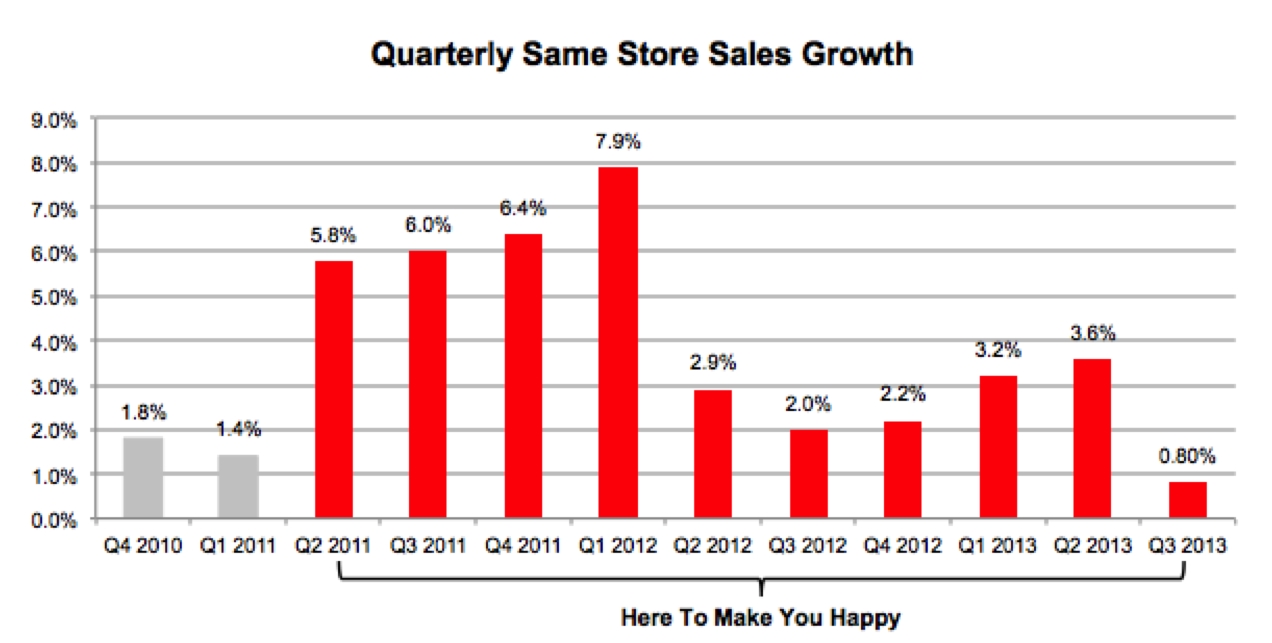
Combined, these 11 straight consecutive quarters of growth represented an annual growth rate of 3.84%, beating their objective by 156%. [Footnote [1]
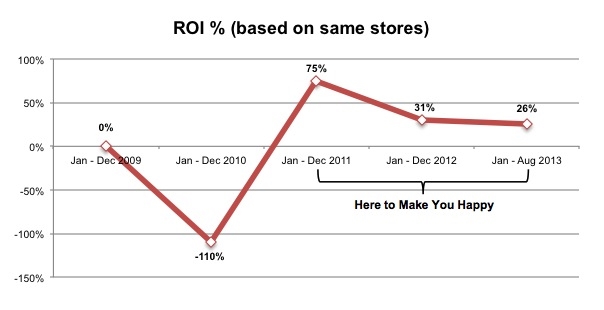
More impressive still, is the effect that the campaign had on BP’s marketing ROI [Footnote [2]. Measured on the year-over-year variance of total net sales versus total media spend, BP saw tremendous growth throughout the campaign, as shown in the chart below:
During each of the 11 quarters of the Here to Make You Happy campaign, a new promotional campaign was launched featuring a BP menu item or service offering. While the brand saw sales growth with each of the campaigns, five are highlighted here:
Wings – “Flatties & Drummies” (April–June 2011)
- Over the course of the campaign, BP sold so many wings that finding product stock became a challenge. In total, BP sold 560,500 plates of wings, totalling over $6.5 million. This represented a 162.3% increase in year-over-year sales [Footnote [1].
- Sales represented a 138% marketing ROI [Footnote [2].
- The social extension portion of the campaign drove 26,649 new fans to join BP’s Facebook page, exceeding their target by 488%. [Footnote [3]
- At the time, it was the brand’s most successful product launch.
Major Awards:
- CMA 2011 – Gold (Retail)
- CASSIES 2012 – Bronze (Off to a Good Start)
- The Bessies 2012 – Gold (Film for Television, Single)
- The Bessies 2012 – Gold (Craft, Film Casting)
- The Effie Awards 2012 – Gold (Restaurants)
Take Out and Delivery – “Finger Cooking” (September 2011–February 2012)
Flight 1
- Online TOD sales of $4 million represented year-over-year SSSG of 20.1%. [Footnote [4]
- When compared to the four months prior to campaign launch, online TOD sales were up 123.8%. [Footnote [10]
- Marketing ROI for the campaign was almost 300%. [Footnote [5]
- Repeat orders for the campaign jumped from 35% to 47% post campaign. [Footnote [11]
Flight 2
- Following the success of the first flight, BP set a goal of 15% SSSG, which the campaign exceeded by hitting 26%. This represented total sales of $5.5 million. [Footnote [6]
- The trend of exceeding expectations continued with sales versus the previous four months, jumping 194.1%. [Footnote [11]
- Marketing ROI for the second flight was nearly 900%. [Footnote [11]
- Unaided awareness of BP’s TOD offering also increased significantly, from 14% the year before to 30%. [Footnote [7]
Major Awards:
- CMA 2012 – Gold (Consumer Services)
- CASSIES 2012 – Bronze (Off to a Good Start)
- CASSIES 2013 – Bronze (Services)
- CASSIES 2013 – Bronze (Best Launch)
- The Effie Awards 2013 – Silver (Restaurant)
Boneless Wings – “All Meat Wings” (April–June 2012)
- At the end of the campaign, overall wing sales had spiked 54.7% year over year, which is particularly impressive given that the numbers are measured against the Flatties & Drummies campaign from the year before. [Footnote [8]
- During the campaign, 50% of all wings sold across Canada were All Meat Wings, signalling a significant behavioural shift. [Footnote [14]
Major Awards:
- CASSIES 2013 – Bronze (Events, Seasonal and Short-Term)
Pizza Burger (April–June 2013)
- The Pizza Burger became – and remains – the most successful product launch in the brand’s history, with 353,000 Pizza Burgers sold over the course of the campaign. [Footnote [9]
- Driven by Pizza Burger sales, overall burger sales jumped 232% versus the previous year, far exceeding the 50% gain that was forecast. [Footnote [15]
- The Pizza Burger also impacted overall sales, increasing SSSG in the restaurant by 4.4% (110% over forecast), largely driven by the 43% increase in guest count. [Footnote [15]
- The Pizza Burger also drove online sales for the business, becoming the top seller online after only one-day in-market. [Footnote [15]
Major Awards:
- CMA 2013 – Bronze (Consumer Products, Food & Beverage)
Ribs – Rib Stain Camo (July–August 2013)
- The Rib Stain Camo infomercial was viewed 226,991 times on YouTube, earning a spot on the site’s Ad Leaderboard. [Footnote [10]
- The video and supporting online media drove 123,706 visitors to the dedicated microsite/online store, where they could purchase their very own Rib Stain Camo T-shirt. [Footnote [11]
- The site saw an incredible 2.3% conversion (purchase) rate, which forced three reprints of the T-shirt to meet demand. [Footnote [12]
- After three weeks, year-over-year rib sales were up 70%. [Footnote [18]
- Marketing ROI for the campaign was 124%. [Footnote [18]
Major Awards:
- Strategy B!G Awards – Bronze
- Media Innovation Awards – Silver (Best in Retail/E-Commerce)
- The Marketing Awards – Gold (Collateral Campaign)
- AToMIC Awards – Gold (Best Niche Target)
2) Differentiate the Brand
Since 2010, BP’s ranking among casual dining consumers as a restaurant that is unique or different from others in the category has increased by 19% [Footnote [13].
This distinctiveness is evident in all of the work. While the competition was fighting over discounted wing nights, BP was introducing wing critics. While others were offering special after special for online ordering, BP was redefining the category with Finger Cooking. While its competitors were battling over family bundles to lure in busy Moms, BP was enticing Dads with the must-try Pizza Burger.
b) Consumption/ Usage Results
c) Other Pertinent Results
d) Return on Investment
Footnote [1]: Client Sales Data
Footnote [2]: Client Sales Data
Footnote [3]: Facebook Analytics
Footnote [4]: Client Sales Data
Footnote [5]: Client Sales Data
Footnore [6]: Client Sales Data
Footnote [7]: Hotspex, Brand Tracking Study, June 28, 2011
Footnote [8]: Client Sales Data
Footnote [9] : Client Sales Data
Footnote [10] : Facebook Analytics
Footnote [11] : Client Sales Data
Footnote [12] : Client Sales Data
Footnore [13] : Client Sales Data
Footnote [14] : Hotspex, Brand Tracking Study, June 28, 2011
Footnote [15] : Client Sales Data
Footnote [16] : Client Sales Data
Footnote [17] : YouTube Insights
Footnote [18] : Google Analytics
Footnote [19] : Client Sales Data
Footnote [20] : Hotspex, 2013 Brand U&A; Tracking, September 2013
Section VI — CAUSE & EFFECT BETWEEN ADVERTISING AND RESULTS
a)General Discussion
Coming out of the recession, the category was in decline and consumers had indicated that they did not intend to return to their prerecession spending levels when it came to going out to eat. This negative trend was compounded by the fact that competition within the category had increased substantially through the 2000s, further dividing an increasingly smaller pie.
In the face of these challenges, BP completely reshaped their communications and forged a completely new path. In so doing, they drove an unheard-of 11 consecutive quarters of SSSG, amounting to an average growth rate of 3.84% [Footnote [1]. Over the same period, growth for all of BP’s publicly reported competitors averaged only 0.52% [Footnote [2]. So, while there was still mild growth in the category, BP’s change in direction drove significantly greater growth.
b)Excluding Other Factors
Spending Levels:
Marketing spend is derived from franchise sales, so moderate increases in media spend were implemented over the course of the campaign. Comparing the average monthly media spend of the campaign years to the average level of monthly spending of the two previous years (2009 and 2010), spend increased by 7% in 2011 and by 15% in both 2012 and 2013.
Pricing:
Prices actually increased steadily throughout the campaign, rising by an average of 2.4% per year. This increase was just above the national average inflation rate for the period of 1.79% [Footnote [1], and while a factor in revenue growth, it was still well below the same stores sales figures.
Distribution Changes:
Between 2005 and 2011, BP grew from 200 to 338 stores, driving tremendous growth for the brand, but leaving little opportunity to further grow through expansion. Nine new stores were opened over the course of Here to Make You Happy, but it was the reshaping of the brand that drove the new growth.
Unusual Promotional Activity:
To maintain a premium position in the category, BP avoided discounting and price promotions throughout the campaign.
Other Potential Causes:
None.
Footnote [1] : Client sales data.
Footnote [2] : Hotspex, 2011 Brand U&A; Tracking, June 2011.
Footnote [3] : Client sales data.
Footnote [4] : Statistics Canada, “Labour Force Survey,” 2010.
Footnote [5] : Statistics Canada, “Indicators of Well-Being in Canada: Unemployment Rate,” 2012.
Footnote [6] : Client sales data.
Footnote [7] : Client sales data.
Footnote [8] : Client sales data.
Footnote [9] : Client sales data.
Footnote [10] : Facebook Analytics.
Footnote [11] : Client sales data.
Footnote [12] : Client sales data.
Footnote [13] : Client sales data.
Footnote [14] : Hotspex, Brand Tracking Study, June 28, 2011.
Footnote [15] : Client sales data.
Footnote [16] : Client sales data.
Footnote [17] : YouTube Insights.
Footnote [18] : Google Analytics.
Footnote [19] : Client sales data.
Footnote [20] : Hotspex, 2013 Brand U&A; Tracking, September 2013.
Footnote [21] : Client Sales Data
Footnote [22] : Client Sales Data
Footnote [23] : Triami Media BV, “Historic inflation Canada – CPI Inflation”, July 2014